Coding Stories: Standing on the Shoulders of Giants
When I was ten years old I was given a Commodore 64 and I learned to code in BASIC. When I was in college I learned C to develop a Monte Carlo simulation for a Physics professor. As a science teacher I saw programming as a way to help students explore the natural world. Now I work with students and teachers to find the intersection of coding and learning. This blog documents my coding stories.
Issac Newton one of the most distinguished scientists of the western world once stated that he stood on the shoulders of giants giving credit to previous scientists upon whose work his discoveries were built. I use this phrase in the title because so often coding is not only built on the work of those who created computers, developed languages, and pioneered solutions to computational problems, but coding is also more immediately the reworking of existing code that is frequently freely shared. In this article I will narrate the use of existing ideas and code to hopefully create an interesting story.
Ancient Astronomy
The ancients lacked computational devices in their study of the heavens. Yet we are heavily reliant on these tools in contemporary astronomy. So I thought it would be interesting to switch things up and see where computers might complement ancient ideas. I began my investigation by reading, The Copernican Revolution by Thomas Kuhn to get a better sense of the ancient perspective on the universe.
A central focus of Kuhn’s book is to immerse the reader in the conceptual power of the two sphere universe. The first sphere is the earth stationary at the center. The second sphere contains all the stars at a fixed large distance away. Today we can’t imagine believing the earth to be the center of things. Even young children dismiss Ptolomy’s geocentric theory as ridiculous since we all know the sun is the center of our solar system. For children who have read books on space they might take the argument further arguing that the sun is just one star of billions in our galaxy and our galaxy is one of billions in the universe. We might wonder why it took Copernicus so long to come up with such an obvious idea. It is for this reason that Kuhn takes the time to walk us through what evidence was available in ancient times and what explanatory theories were of value. If you ask someone today to explain what evidence they have for a heliocentric theory of the solar system what would they say? Can they provide tangible evidence for their ideas? Chances are that they can’t.
The story is further complicated by the fact that in the modern world, familiarity with the night sky is becoming less and less common. This is particularly the case where I live in New York City. Between excessive light pollution and an abundance of evening activities that keep our eyes off of the heavenly bodies I can go months without noticing the phase of the moon, the constellations in view, or which planets are visible. Part of my motivation is to rectify this situation.
So let’s try to imagine what the world of the ancients might have been like once the sun went down. One way to do this is to drive far away from light pollution, find a remote spot perhaps in a clearing and turn off all the lights. I look up and see thousands of points of light that we, like the ancients, call stars. You don’t need any special equipment for this experiment except perhaps glasses if your eyes fail you as mine have started doing (too bad for the ancients on this one). Now just sit back and watch. If you have the patience to wait for a while you might notice that these points of light are moving across the sky in well defined curved paths. This pattern as well as many others got the ancients thinking about predictive models for their observations and theories to explain the structure of the universe.
What is important here is that the path of the stars is not only predictable during the evening but if you follow the path of a star on the imaginary large sphere from the end of the night to where it appears at the start of the next evening it is as if it travelled the same path all day long despite not being visible. In fact the path of the stars is perfectly explained through placing them on this large rotating sphere. The sphere theory perfectly explains the observations and it is much more sensible than a rotating earth. After all if the Earth was spinning why would everything seem so still.
I want to dig deeper into this evidence and the theories. Instead of renting a car and driving 150 miles, ironically, I am going to access the ancient experience using the web. With p5.js I will make a brilliant night sky full of stars in my browser window. Somehow this seems a fitting New York approach to turning back the clock on the industrialized world. I started by drawing one star as a small circle of white on a black background.
fill(255);
circle(200,200,50);
Then I added a thousand of them randomly on the canvas with this code.
function setup() {
  createCanvas(windowWidth, windowHeight);
  background(0);
  textSize(36);
  textAlign(CENTER);
  fill(225);
  text("Click Screen to Start Over",width/2,height-50);
}function draw() {
  if (frameCount>1000) noLoop();
  let r = random(200,255);
  let g = random(230,250);
  let b = random(10,255);
  stroke(r,g,b);
  strokeWeight(random(1,4));
  point(random(width), random(height));
  strokeWeight(0);
}function mousePressed() {
  background(0);
  frameCount = 1;
  loop();
}
This is what it looks like:
I enjoyed this project, but it is not reality. I want the actual night sky that is out there if you shut off all the power. To get an accurate sky I need the locations of the stars. As it happens astronomers eagerly share this information with anyone who might be listening. From the Yale Bright Object Catalog I grabbed the 2937 brightest stars. The brightness of a star as viewed from earth is listed as its magnitude. I included down to magnitude 5 which approximates the light sensitivity of the human eye. Each star also includes a position given by its right ascension which is the equivalent of theta in spherical coordinates or longitude, and the declination which is the equivalent of phi or latitude giving the positive or negative angle from the equator. I had to be careful where angles were measured from and subsequently made some adjustments along the way. Strangely enough this modern system exactly aligns with Ptolomy’s theory of a large sphere of stars. This is the first clue of the useful qualities of the ancient theory. It is much simpler to think about the stars on this imaginary sphere than their cartesian coordinates across a vast universe. The power of a theory in science is based on its explanatory power and Ptolomy’s large sphere theory adeptly predicts the positions of the stars over time in the night sky. It is also easy to visualize. The challenge now is to figure out how to make this all happen in the browser.
This is when the math hits and to be honest with you it hit me harder than I expected. The spherical coordinates given in the catalog can be converted from hours, minutes and seconds into radians. Those coordinates correspond to the position of a star as it would exist on a large imaginary sphere at midnight on the start of the year 2000. The size of the imaginary sphere is not so important because we view stars in terms of their angular position. If at that exact moment in time I were standing on the North pole then I could look up and see all the stars north of the equator. To put them on the screen I need to make them flat in some way and for that we use a projection. I chose the stereographic projection for this.
From the north pole this projection can simply be expressed in polar coordinates on a circle. In this case phi needs to be measured from from the pole instead of the equator. This formula uses capital theta for the polar coordinates and lowercase phi and theta for the spherical
And then to put this on the web I will calculate the rectilinear coordinates using the following formulas expressed in JavaScript
let x = ro * Math.sin(theta);
let y = -1*ro * math.cos(theta);
So I read in the catalog of stars and created the following view of that particular sky.
This image is not exactly correct. The four directions should actually all be listed as South. I had written this screen for my NYC location without considering the special case of the north pole. The next step is to consider if I happen to not be on the North Pole. To get the projection from an arbitrary viewing point on earth I wrote the following calculation.
function stereographicProjection(pos,size) {
let sphi = Math.sin(pos.dec);
let cphi = Math.cos(pos.dec);
let lamda = pos.ra;
let phi1 = lat.value()*1.74532925199433e-2; //lattitude
let sphi1 = Math.sin(phi1);
let cphi1 = Math.cos(phi1);
let lam0 = (long.value()-90)*1.74532925199433e-2; //longitude
let k = (size/2) /(1+sphi1*sphi+cphi1*cphi*Math.cos(lam-lam0));
pos.x = -1*k*cphi*Math.sin(lam-lam0);
pos.y = -1*k*cphi1*sphi-sphi1*cphi*Math.cos(lam-lam0));
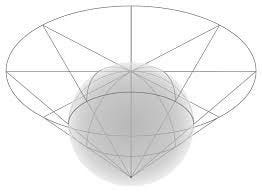
}I computed this by performing two rotation transformations followed by the stereographic projection. The first rotation is around the axis of the earth and the second rotates to the correct latitude value. Finally it projects the sphere on a plane tangent to the sphere projected from the point exactly opposite to the viewing location on the sphere. I should probably discard the hemisphere closest to the projection point by limiting x and y to the defined circle on the diagram above. I also scaled the circle to the size variable based on the canvas size in the browser. Using this function I can transform the spherical coordinates for each star to a flat circular representation of the night sky. As it happens the d3.js library handles these projections as well but I did not find that until I did all this math and so I will leave that as an exercise for you.
In my program I will also need a loop to do this calculation for each star.
for (let s of this.star) {
  this.stereographicProjection(s.pos);
  stroke(s.color);
  strokeWeight(s.radius);
  point(s.pos.x,s.pos.y);
}
The next step is to consider that the time might have changed. We could create a time system where 0 is the start of the year 2000 and then count the number of seconds that passed since that time. Star position is actually easier to handle than you might expect. All I need to do is to rotate the big sphere around its axis to the correct position. I can do this by changing the value of the right ascension. The Earth turns at a pretty uniform rate which can be expressed as 7.433434 x 10-⁵ radians/second. So if I know how many seconds passed from the beginning of year 2000 I can simply multiply to get the current right ascension value. I added the following line to my stereographicProjection() function.
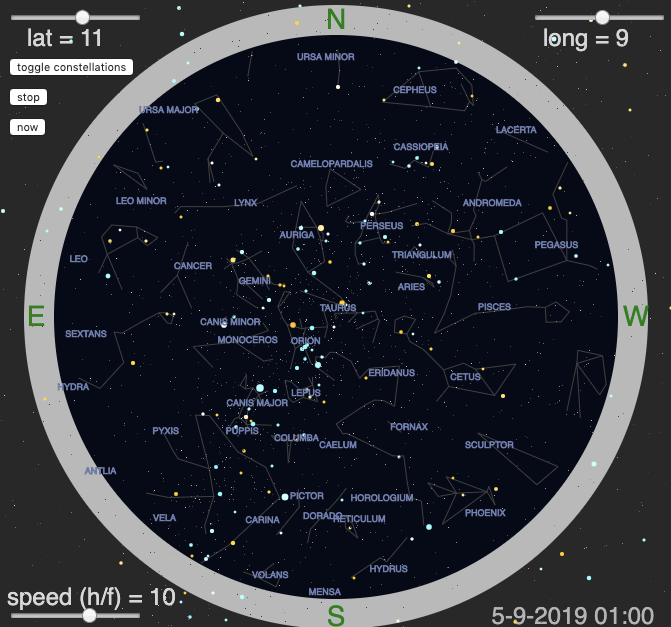
let rightAscension = pos.ra — 7.292115090e-5 * secondsFromJ2000;Putting all of this together gives a pretty good approximation of where the stars appear to be located from a specific point on earth. I put all the code together. Then I spend some time cleaning it up by creating a BigSphere class that held all the star data, the current time, and the methods to calculate the positions, update the time and display the sky. I created the following web app with some sliders and buttons to show the visible sky. Notice that I did not discard the stars that are below the horizon and you can see them faintly outside of the circle for visual effect.
At this point I was impressed with myself that I had created a star view using the web. In some ways the code is not as complex as I originally expected it to be. However I should mention that it took me a few weeks to get it working. I think this is an important point about building on current knowledge. Access to information was not an issue. There were numerous websites that contained the information required to implement this app. Many of these sites were filled with technical terms that at first confused me. Technical terms can be very helpful when trying to describe something complex with specificity. You could argue that the reason it took me so long to understand it is that these ideas are complex and require time and dedication to absorb. However, as I read through the materials it seemed that there might be more accessible ways to share knowledge that reduce the barriers of entry. I believe these barriers limit who has access to STEM knowledge, and who benefits from the political power that comes with this knowledge. This may explain some of the biases that still pervade STEM fields. Another thing to consider is that developing the competencies to interpret, synthesize and leverage this knowledge is not always a major focus of K-12 classrooms. I wonder what are the best ways to teach these skills.
Getting back to the model there were a few issues that need to be addressed. The first regards accuracy. An astronomer could challenge my model because I did not take into account the irregularities in the orientation of the Earth’s axis. Precession and nutation are two effects that astronomers use to adjust the position of the Earth to accurately define the positions of objects in the sky. The various effects get so complex that Euler studied it perhaps an indication of the level of complexity involved. The orientation of the axis is affected by the sun, the moon, the oceans and even the movement of magma in the Earth. If I wanted more precision I would need to come up with an algorithm to address these effects. The second issue is that there are a number of celestial objects that I ignored. The most important of which might be the sun. For example it would be nice to display whether the sky is during the day or at night. The moon as well as its correct phase, the planets and even other deep sky objects could be added to the app. While exciting this all requires significant work, learning and synthesizing of knowledge. This is when I decided to re-invoke “Standing on the Shoulders of Giants.” It turns out that someone already made a tool similar to what I was looking for. Below is the link which I encourage you to check out.
I really like this app because it corrects for the precession effect and argues that the nutation is small enough that all calculations are within a pixel or two. Ernie Wright who created this site and wrote all the code includes the sun, moon, and the planets using orbital characteristic properties. He aptly names this function Kepler, the scientist who carefully defined the elliptical path of orbiting bodies. Ernie even put in the phases of the moon. So this is a situation where I will reverse engineer his work to get my animation up and running more quickly. I would also benefit form making sense of what he has done to ensure it is correct and figure out how to modify it. While working with someone else’s code certainly saves me time and probably expands what I can accomplish there is a lot of knowledge involved in this work. I am not just cutting and pasting code randomly. I have to understand it enough to know where to put it and how to adjust it. This is a skill that my students often struggle with and I would like to better understand how to support them. I also emailed Ernie to make sure he was okay with my using his work.
The first step was to make a copy of the above project. I then replaced my calculations with Ernie’s calculations to make sure that all aspects of the program worked well together. I pasted in Ernie’s skypos_transform(pos) function in place of my stereographicProjection() function. I could have refactored his code but I was worried that I might run into unit issues later if I was not careful. For example Ernie used Julian days instead of seconds from J2000 to define time so I converted my code to his system to make porting other functions easier. Turning seconds to days just means multiplying by 60*60*24. I also double checked that all the angles were being defined the same way so that my north star did not end up below the south pole. After playing around with it long enough to get it to work I was back to something similar to what I created above. That was a good way to check that everything was working correctly and the positions of the stars were consistent. I did refactor some of the code to fit within my object oriented approach.
The next step was to copy more functions from Ernies work including initPlanets(), find_planet(), draw_planet(), find_moon(), and draw_moon(); Now the sky was fully functional and included a number of new celestial bodies. I kept updating the time in the draw() loop to animate the sky but I decided to have each frame advance one complete rotation of the Earth. Astronomers call this a stellar day. This way the stars will appear to be somewhat stationary as the sun, moon and planets move across the sky. Here is the animation I created based on this idea.
I was really proud of this animation. Where the first animation shows the power of the two sphere model in accurately describing the configuration of the night sky, the second app begins to get at some of the limitations of the two sphere universe by including what is referred to as retrograde motion of the planets when they appear to move in opposition to the movement of the stars. However, I wanted to connect more with the ancient model. I found a diagram of it on wikipedia showing the Ptolomy model.
But this does not really give you a complete picture of what the model developed by the ancients looked like in 3D or how it worked. So I investigated three.js a JavaScript library that is used to represent three dimensional shapes in space.
I started by writing a simple program to add a sphere in the center of my scene as well as a camera and some directional light. I also found a tutorial to add a photo of the earth as a texture. This makes it look more realistic.
let w = window.innerWidth;
let h = window.innerHeight;
camera = new THREE.PerspectiveCamera( 55, w / h, 0.01, 10 );
camera.position.set(0, 0.2, .8);
scene = new THREE.Scene();
light = new THREE.DirectionalLight( 0xeeeeee, 1);
light.position.set( 0, 1, 1 ).normalize();
scene.add(light);
let earthMaterial = new THREE.MeshPhongMaterial({
      map  : new THREE.TextureLoader().load('EarthImage.jpg'),
      bumpMap  : new THREE.TextureLoader().load('bumpfile.jpg'),
      bumpScale : 0.01 })
let earthMesh = new THREE.Mesh(new THREE.SphereGeometry(radius/4.0, 32, 32), earthMaterial);
scene.add( earthMesh );
Then I created a new container called starHolder in the scene to hold all the stars. I tested it out with one star and then I created a loop to add all the stars.
for (let s of star){
  let dec = s.pos.dec;
  let ra = s.pos.ra;
  let sphereGeometry = new THREE.SphereGeometry(s.radius);
  let sphereMaterial = new THREE.MeshBasicMaterial({color:s.color});
  sphere = new THREE.Mesh(sphereGeometry, sphereMaterial);
  let pos = new THREE.Spherical(radius,Math.PI/2 — dec,ra);
  sphere.position.setFromSpherical(pos);
  starHolder.add( sphere );
}
Next I used the functions from Ernies code to find the sun, moon and planets. I placed them at various distances from Earth in correspondence to Ptolomy’s diagram. The lighting of the Earth and the planets gets taken care of automatically once I orient the direction of the light based on the position of the sun. When you run it you can see how the ancient model looks in 3D. I decided to advance each frame to just over one rotation. This makes it look like the large sphere is barely rotating when in reality it is completing a rotation every frame. However, this highlights the movement of the moon, sun and planets. Notice that the moon is revolving the fastest. You can also see the retrograde motion pretty clearly. Click and drag in the app to change your perspective or zoom in or out.
The four animations I created in this article were exciting to create and allowed me to learn a lot about astronomy. I feel that I have a deeper understanding both the ancient models of the universe as well as contemporary ones.
Kuhn writes, “Perhaps the most striking characteristic of the two-sphere universe is the assistance that it gives to the astronomer’s memory. This characteristic of a conceptual scheme is often called conceptual economy.” (p.37) I am intrigued by the idea that you can understand more through clever representations and visualizations. My hope is that through coding we can take this conceptual economy a step further. I also believe we can unlock more of the the beauty in these models.